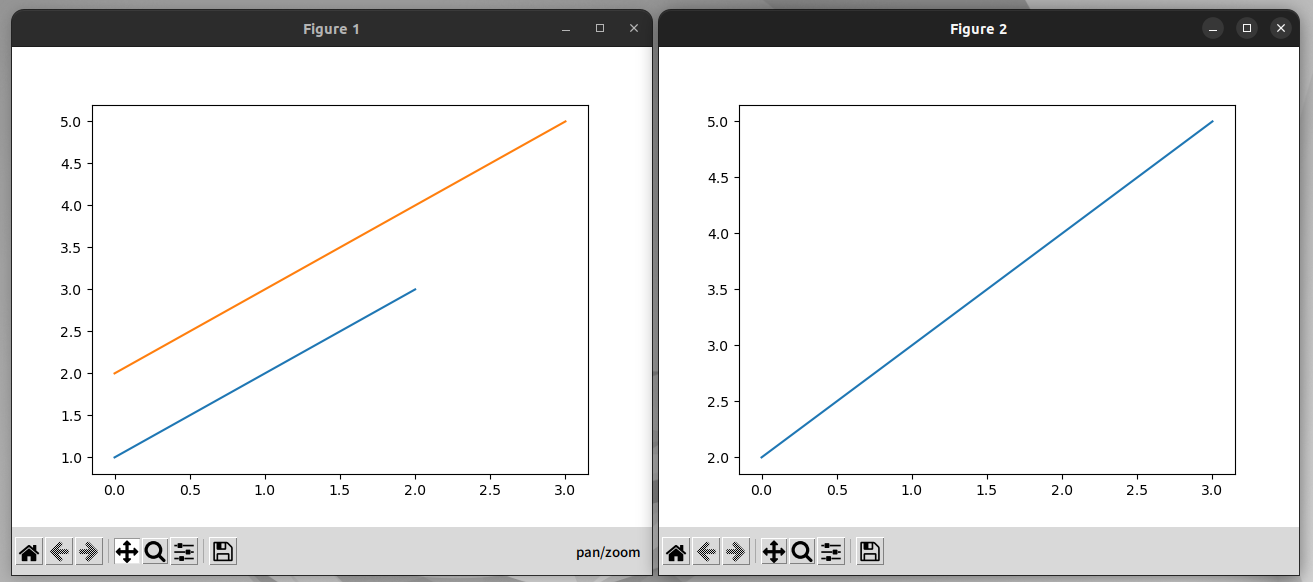
창을 figure라고 하는 것 같은데
openCV는 창을 명시하고 그릴 데이터를 지정한다면
openGL은 선택을 하고 그리는 거라 순서가 필요한데
matplotlib은 openGL 처럼 그릴곳을 선택하고 그리는 컨셉을 사용한 듯.
| >>> plt.ion() # 인터랙티브모드 전환 <matplotlib.pyplot._IonContext object at 0x71521b249b40> >>> plt.figure(1) # 여기서 Figure 1 이라는 창이 열림 <Figure size 640x480 with 0 Axes> >>> plt.plot([1,2,3]) # Figure 1 창에 그래프 그려짐 [<matplotlib.lines.Line2D object at 0x7152194aead0>] >>> plt.figure(2) # 여기서 Figure 2 이라는 창이 열림 <Figure size 640x480 with 0 Axes> >>> plt.plot([2,3,4,5]) # Figure 2 창에 그래프 그려짐 [<matplotlib.lines.Line2D object at 0x71521a9c2410>] >>> plt.figure(1) # UI 상으로 변동은 없으나 Figure 1 창에 그리도록 선택 <Figure size 640x480 with 1 Axes> >>> plt.plot([2,3,4,5]) # Figure 1 창에 추가로 그려짐 [<matplotlib.lines.Line2D object at 0x71521a9eca30>] |
 |
[링크 : https://matplotlib.org/stable/gallery/subplots_axes_and_figures/multiple_figs_demo.html]
하나의 창 안에서 나누는건 subplot 인듯
[링크 : https://stackoverflow.com/questions/41210823/display-multiple-images-in-subplots]
'Programming > python(파이썬)' 카테고리의 다른 글
| python용 얼굴탐지, 인식 (0) | 2025.08.04 |
|---|---|
| python struct (0) | 2024.12.13 |
| python matplotlib 그래프 갱신하기 (0) | 2024.05.27 |
| python soundcard 라이브러리 (0) | 2024.05.21 |
| python 사운드 장치 (0) | 2024.05.10 |

