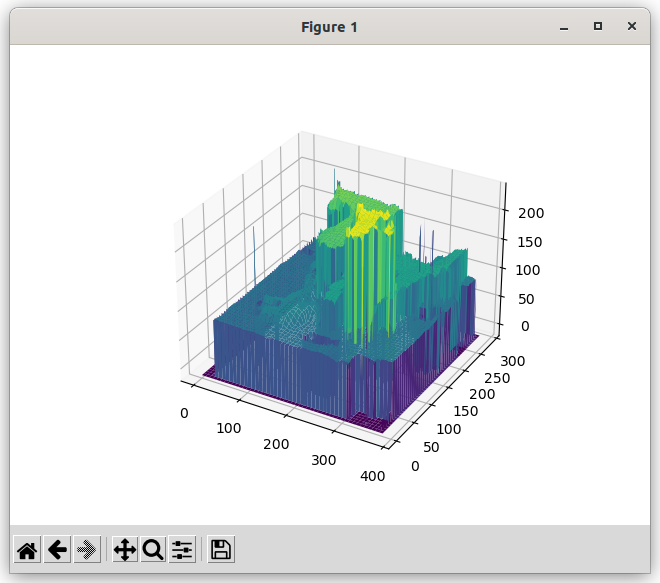
matplotlib을 3d로 그려보는 것 까지 통합완료. 이제 SGBM만 해보면 될 듯
| WLS 필터 미적용 | WLS 필터 적용 |
 |
 |
|
import numpy as np
import cv2 as cv
from matplotlib import pyplot as plt
imgL = cv.imread('tsukuba_l.png', cv.IMREAD_GRAYSCALE)
imgR = cv.imread('tsukuba_r.png', cv.IMREAD_GRAYSCALE)
max_disparity=16
stereo = cv.StereoBM_create(max_disparity, blockSize=15)
disparity = stereo.compute(imgL,imgR)
fig = plt.figure()
ax = fig.add_subplot(111, projection='3d')
# X, Y 좌표 생성
height, width = imgL.shape
x = np.arange(0, width, 1)
y = np.arange(0, height, 1)
x, y = np.meshgrid(x, y)
# 깊이 맵을 사용하여 Z 좌표 생성
z = disparity
# 3D 그래프에 표시
ax.plot_surface(x, y, z, cmap='viridis')
plt.show()
# WLS 필터 적용
right_matcher = cv.ximgproc.createRightMatcher(stereo);
left_disp = stereo.compute(imgL, imgR);
right_disp = right_matcher.compute(imgR, imgL);
# Now create DisparityWLSFilter
wls_filter = cv.ximgproc.createDisparityWLSFilter(stereo);
sigma = 1.5
lmbda = 8000.0
wls_filter.setLambda(lmbda);
wls_filter.setSigmaColor(sigma);
filtered_disp = wls_filter.filter(left_disp, imgL, disparity_map_right=right_disp);
fig = plt.figure()
ax = fig.add_subplot(111, projection='3d')
z = filtered_disp
# 3D 그래프에 표시
ax.plot_surface(x, y, z, cmap='viridis')
plt.show()
|
'Programming > python(파이썬)' 카테고리의 다른 글
| python thread event (0) | 2024.03.05 |
|---|---|
| cv2.ximgproc 없을 경우 (0) | 2024.02.28 |
| matplotlib animation (0) | 2024.02.28 |
| pip 패키지 관리 (0) | 2024.02.27 |
| pyhthon numpy 생략없이 출력 (0) | 2024.02.26 |

